Welcome to eaQTLdb

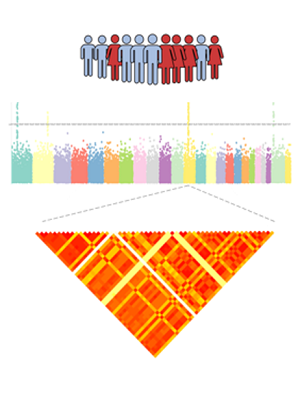
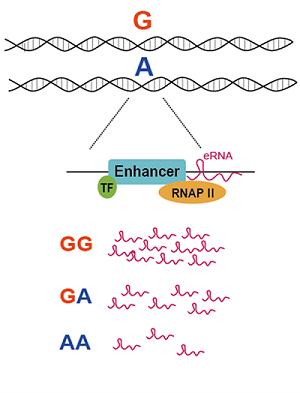
Enhancers are distal regulatory DNA elements that are critical for regulation of gene expression program. Besides the key roles in determining cell identity by establishing cell-type-specific expression patterns, enhancers have been increasingly recognized as important players in the pathogenesis of human complex diseases, such as cancer. Emerging studies have revealed that active enhancers could be pervasively transcribed into noncoding RNAs called enhancer RNAs (eRNAs), which could be used as an index of enhancer activity. Aberrant expression level of eRNAs is highly associated with enhancer malfunction and have been demonstrated in multiple cancer types. Despite indispensable roles of eRNA in gene regulation, the contributions of genetic variation to eRNA expression remain largely unexplored. The eaQTLdb is a comprehensive database for exploring enhancer activity quantitative trait loci (eaQTL) which are referred as single nucleotide polymorphisms (SNPs) that affect eRNA expression based on multi-omics data from The Cancer Genome Atlas (TCGA).


What can eaQTLdb do

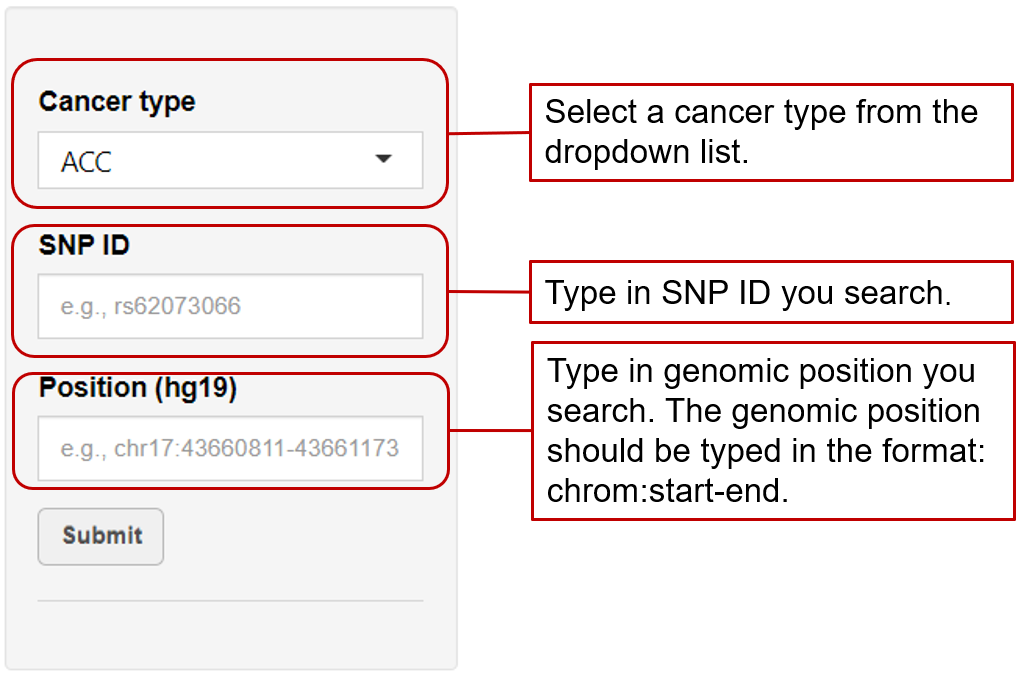
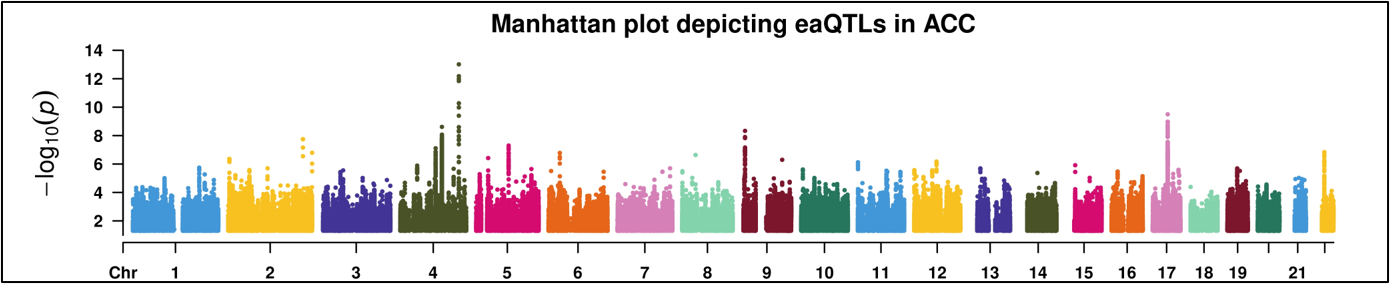
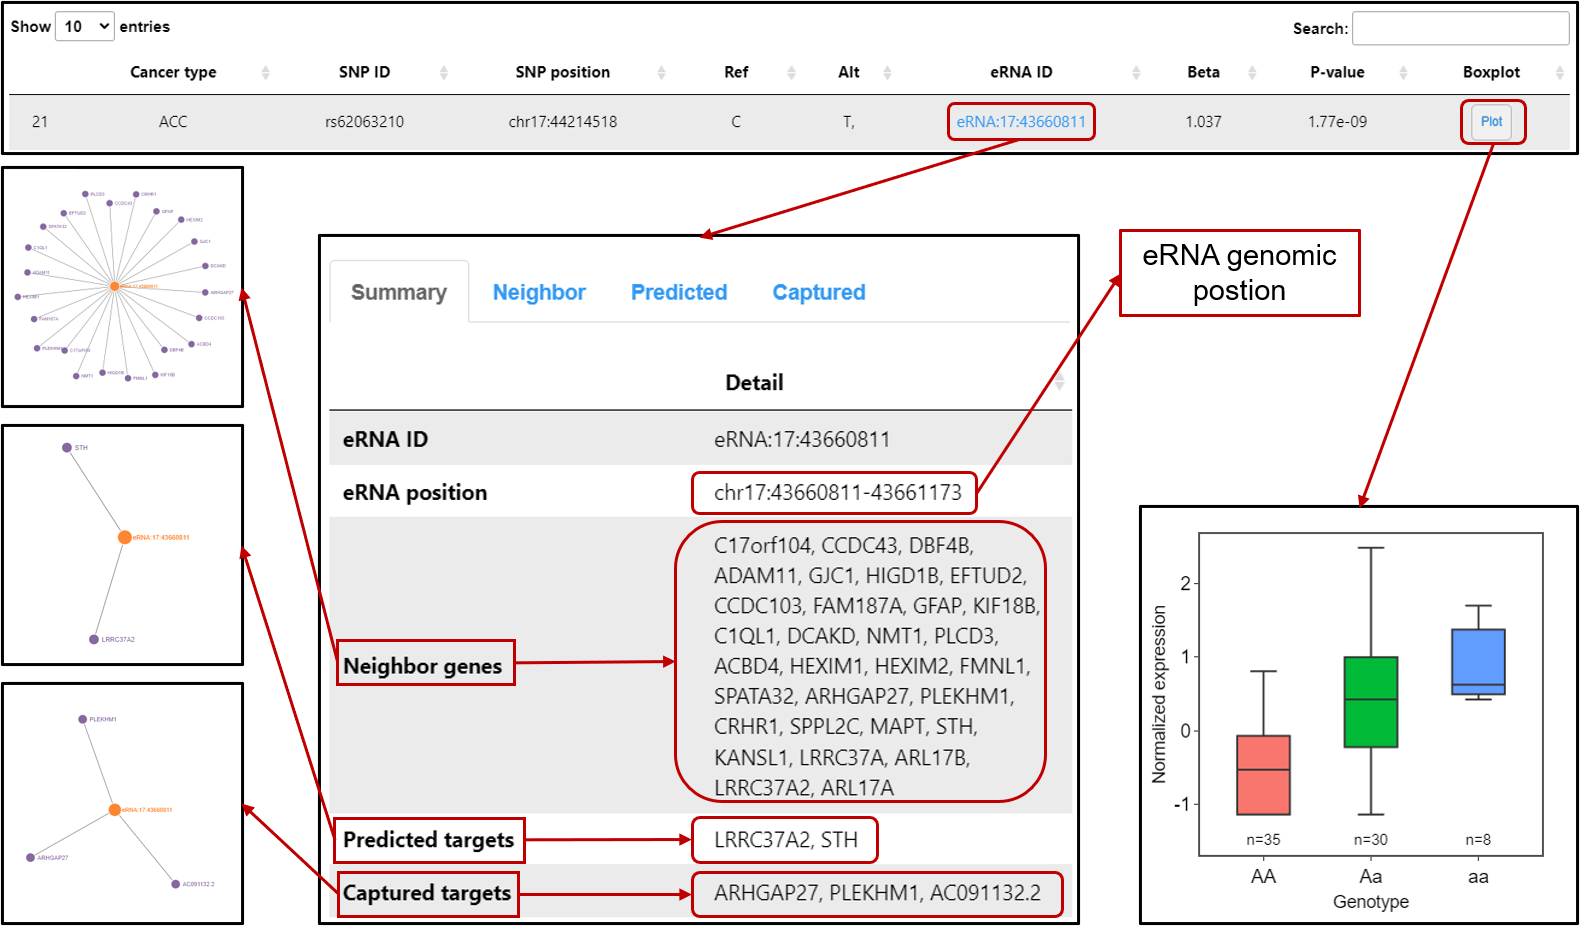
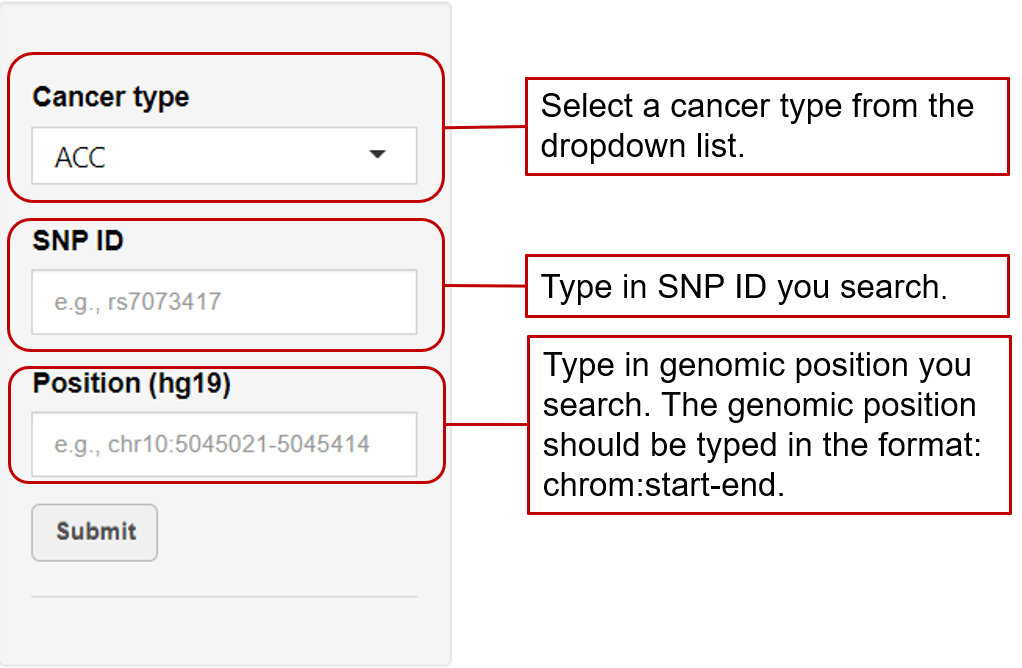
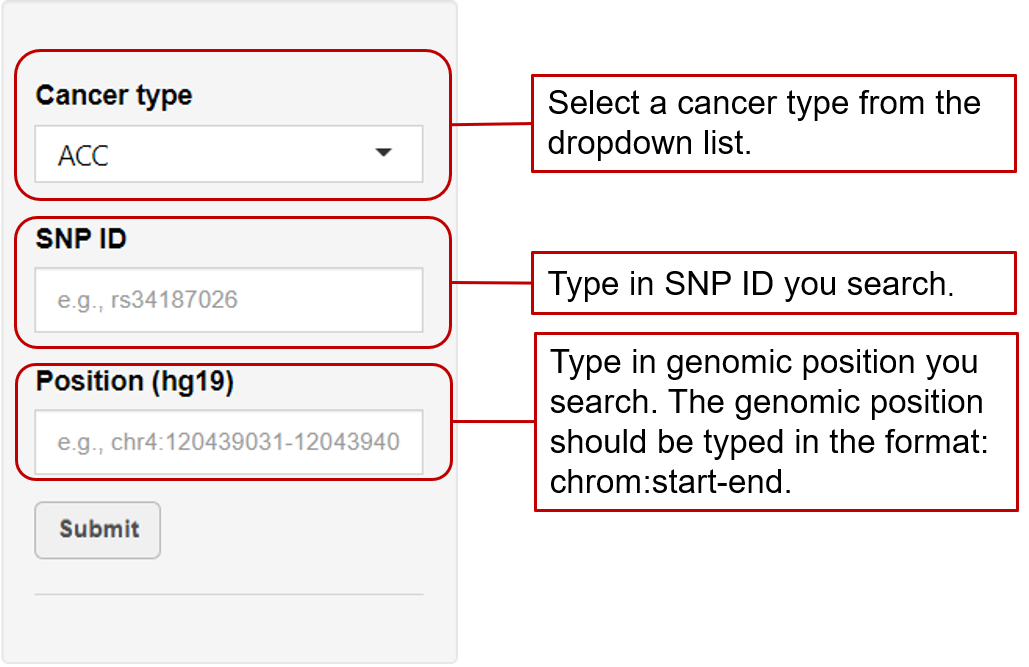
eaQTL: Browse or search eaQTLs across different cancer types

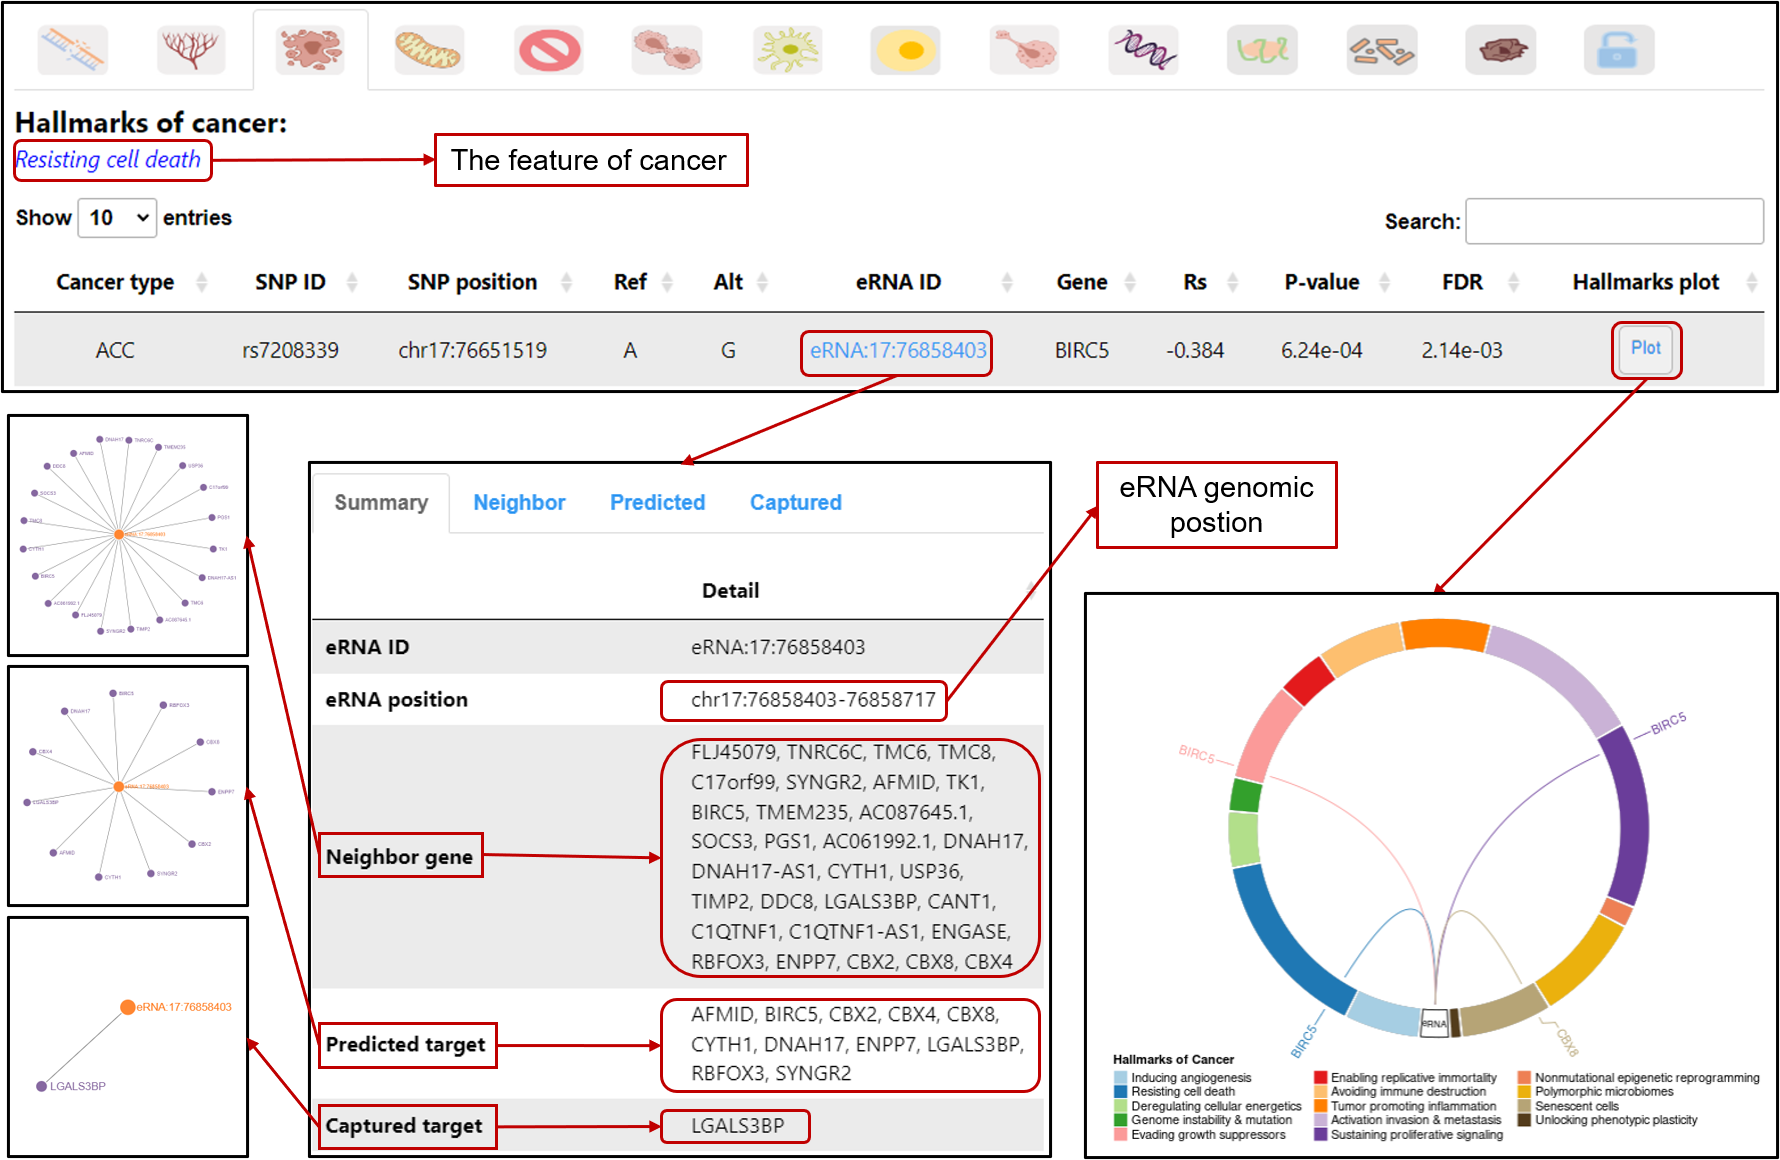
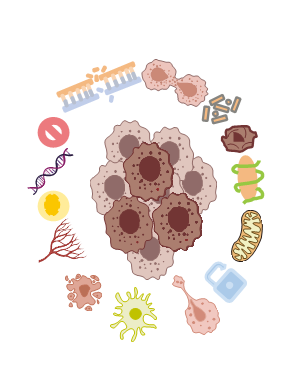
Hallmark-eaQTL: Browse or search eaQTLs associated with hallmarks of cancer

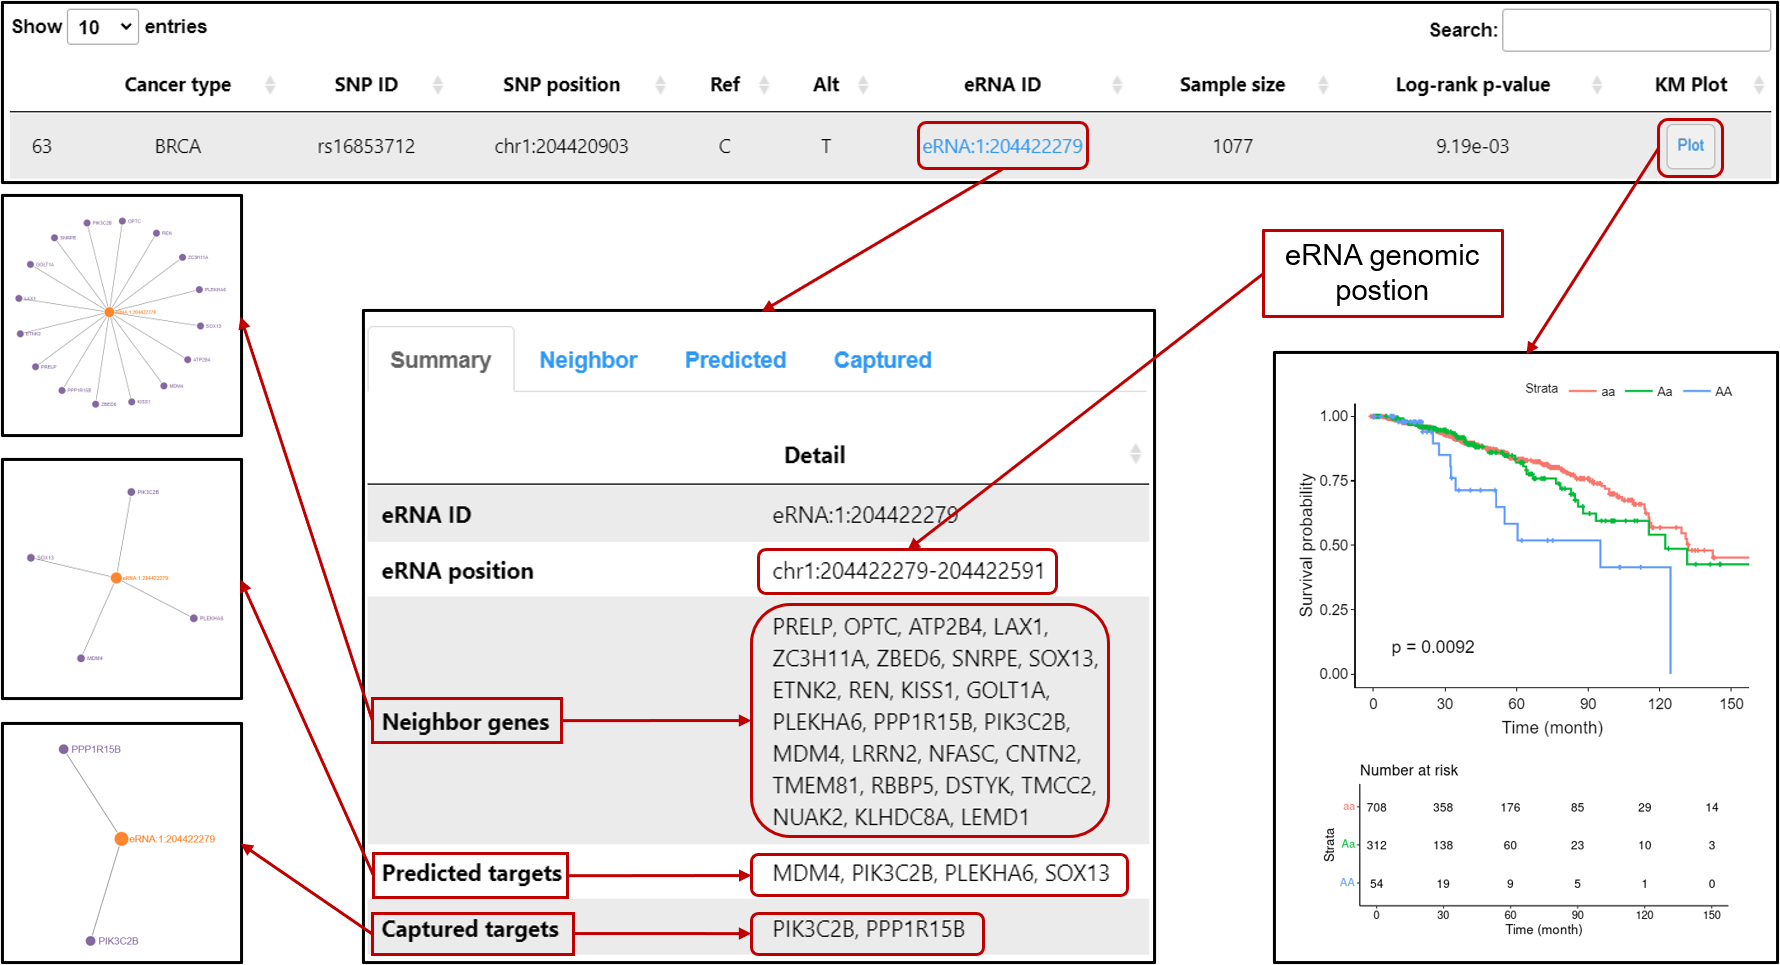
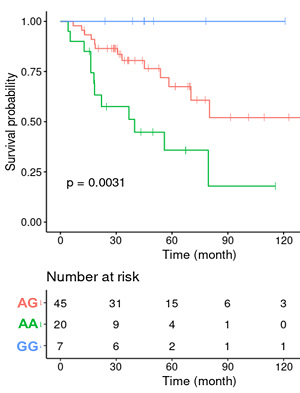
Survival-eaQTL: Browse or search eaQTLs associated with patients' overall survival

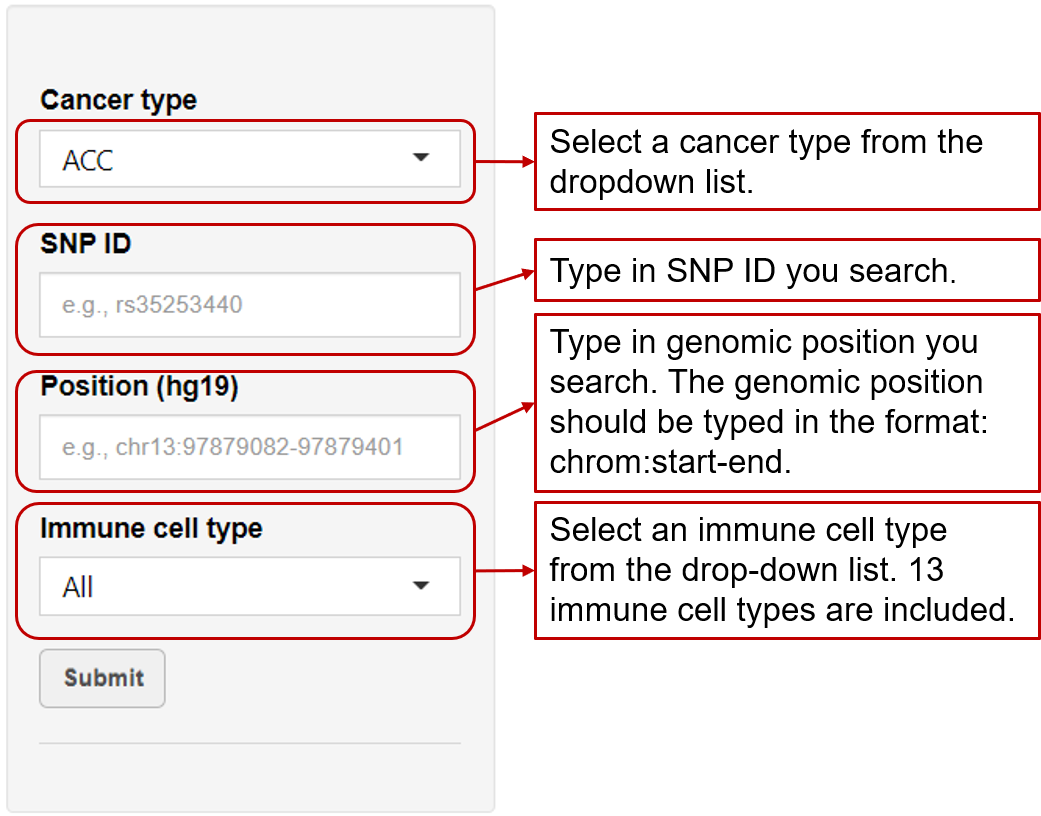
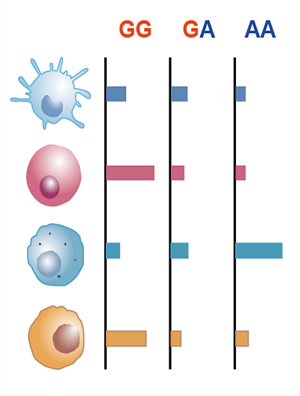
Immune-eaQTL: Browse or search eaQTLs correlated with immune cell infiltration in tumors

GWAS-eaQTL: Browse or search eaQTLs colocalized with diseases/traits-associated SNPs

Download: Download all browsed or searched eaQTL results


How to cite

eaQTLdb: An atlas of enhancer activity quantitative trait loci across 33 cancer types

Jiapei Yuan, Yang Tong, Xiaochuan Liu, Mulin Jun Li, Qiang Zhang, Yang Yang (2023) Int J Cancer

Function Modules

eaQTL

Hallmark

Survival

Immune

GWAS

Overview of eaQTLdb

Number of samples of each cancer type

Summary of eaQTLdb


Loading...

Download


Hallmarks of cancer:
Genome instability & mutation

Hallmarks of cancer:
Inducing angiogenesis

Hallmarks of cancer:
Resisting cell death

Hallmarks of cancer:
Deregulating cellular energetics

Hallmarks of cancer:
Evading growth suppressors

Hallmarks of cancer:
Enabling replicative immortality

Hallmarks of cancer:
Avoiding immune destruction

Hallmarks of cancer:
Tumor promoting inflammation

Hallmarks of cancer:
Activating invasion & metastasis

Hallmarks of cancer:
Sustaining proliferative signaling

Hallmarks of cancer:
Nonmutational epigenetic reprogramming

Hallmarks of cancer:
Polymorphic microbiomes

Hallmarks of cancer:
Senescent cells

Hallmarks of cancer:
Unlocking phenotypic plasticity


Loading...

Download


Loading...

Download


Loading...

Download


Loading...

Download


1. eaQTL

Browse or search eaQTL

A summary Manhattan plot is displayed for each cancer type on the top panel. A boxplot is provided to show the association between genotype and eRNA expression by clicking “Plot” button in the end of each row. A tabular and dynamic graph view are provided to show neighbor genes, predicted and captured targets for each eRNA by clicking “eRNA ID”, and this function is also available in other four modules. And in each module, users could select cancer type, SNP ID, or eRNA position from the tabular in the left panel.


Input


User should select a cancer type from the drop-down list to browse eaQTLs in a specific cancer type.

User could enter SNP ID to search eaQTL for a specific SNP.

User could enter an interesting potential enhancer genomic position to search eaQTL.


Result


This section provides manhattan plot depicting eaQTLs for query cancer type along the 22 human chromosomes. Each dot represents a potential eaQTL, and the Y-axis represents -log10 P-value.


This section provides tabular view of eaQTLs for query cancer type/SNP ID/genomic position. It includes:

  • Cancer type: The cancer type is denoted by TCGA abbreviations.
  • SNP ID: Reference SNP ID from dbSNP.
  • SNP position: The genomic position of SNP.
  • Ref: The reference allele.
  • Alt: The alternative allele.
  • eRNA ID: The eRNA ID is named by genomic position.
  • Beta: Effect size estimated by Matrix eQTL.
  • P-value: P-value estimated by Matrix eQTL.
  • Boxplot: The boxplot depicts the association between genotype and eRNA expression. The Y-axis represents normalized eRNA expression and the X-axis represents different genotype.
  • eRNA position: The genomic position of eRNA.
  • Neigbor genes: The neigbor genes of each eRNA are provided with tabular view and graph view.
  • Predict targets: The predicted target genes of each eRNA are provided with tabular view and graph view.
  • Captured targets: The target genes of each eRNA captured using 3D genomic methods (ChIA-PET, Hi-C, Capture Hi-C) are provided with tabular view and graph view.

2. Hallmark-eaQTL

Browse or search eaQTL associated with hallmarks of cancer

A circle plot is displayed to show the association between targets of eRNA and hallmarks of cancer by clicking “Plot” button in the end of each row. The hallmark of cancer could be selected by clicking the icon of each hallmark in the top panel in this module.


Input


User should select a cancer type from the drop-down list to browse eaQTLs in a specific cancer type.

User could enter SNP ID to search eaQTL for a specific SNP.

User could enter an interesting potential enhancer genomic position to search eaQTL.


Result


This section provides tabular view of eaQTLs associated with hallmarks for query cancer type/SNP ID/genomic position. It includes:

  • Cancer type: The cancer type is denoted by TCGA abbreviations.
  • SNP ID: Reference SNP ID from dbSNP.
  • SNP position: The genomic position of SNP.
  • Ref: The reference allele.
  • Alt: The alternative allele.
  • eRNA ID: The eRNA ID is named by genomic position.
  • Gene: The predicted target gene.
  • Rs: The Spearman’s rank correlation coefficient between eRNA and the predicted target gene expression level.
  • P-value: P-value of correlation test.
  • FDR: The false discovery rate adjusted P-value of correlation test.
  • Circleplot: The Circleplot depicting the association between eRNA and hallmarks of cancer.
  • eRNA position: The genomic position of eRNA.
  • Neigbor genes: The neigbor genes of each eRNA are provided with tabular view and graph view.
  • Predicted targets: The predicted target genes of each eRNA are provided with tabular view and graph view.
  • Captured targets: The target genes of each eRNA captured using 3D genomic methods (ChIA-PET, Hi-C, Capture Hi-C) are provided with tabular view and graph view.

3. Survival-eaQTL

Browse or search eaQTL associated with patients' overall survival

A Kaplan-Meier plot is displayed to show association between genotype and patients’ overall survival rate by clicking “Plot” button in the end of each row.


Input


User should select a cancer type from the drop-down list to browse eaQTLs in a specific cancer type.

User could enter SNP ID to search eaQTL for a specific SNP.

User could enter an interesting potential enhancer genomic position to search eaQTL.


Result


This section provides tabular view of eaQTLs associated with patients' overall survival for query cancer type/SNP ID/genomic position. It includes:

  • Cancer type: The cancer type is denoted by TCGA abbreviations.
  • SNP ID: Reference SNP ID from dbSNP.
  • SNP position: The genomic position of SNP.
  • Ref: The reference allele.
  • Alt: The alternative allele.
  • eRNA ID: The eRNA ID is named by genomic position.
  • Sample size: Number of samples used in survival analysis.
  • Log-rank p-value: P-value estimated by log-rank test.
  • KM plot: The Kaplan-Meier plot depicts the association between genotype and patients' overall survival. The “At Risk” table are shown below the Kaplan-Meier plot.
  • eRNA position: The genomic position of eRNA.
  • Neighbor genes: The neighbor genes of each eRNA are provided with tabular view and graph view.
  • Predicted targets: The predicted genes of each eRNA are provided with tabular view and graph view.
  • Captured targets: The target genes of each eRNA captured using 3D genomic methods (ChIA-PET, Hi-C, Capture Hi-C) are provided with tabular view and graph view.

4. Immune-eaQTL

Browse or search eaQTL associated with immune cell infiltration

A boxplot is displayed to show the association between genotype and immune cell abundance by clicking “Plot” button in the end of each row.


Input


User should select a cancer type from the drop-down list to browse eaQTLs in a specific cancer type.

User could enter SNP ID to search eaQTL for a specific SNP.

User could enter an interesting potential enhancer genomic position to search eaQTL.

User could select a immune cell type from the drop-down list to search eaQTL associated with specific infiltrated immune cell type.


Result


This section provides tabular view of eaQTLs associated with immune cell infiltration for query cancer type/SNP ID/genomic position. It includes:

  • Cancer type: The cancer type is denoted by TCGA abbreviations.
  • SNP ID: Reference SNP ID from dbSNP.
  • SNP position: The genomic position of SNP.
  • Ref: The reference allele.
  • Alt: The alternative allele.
  • eRNA ID: The eRNA ID is named by genomic position.
  • Immune cell: The infiltrated immune cell type whose abundance was caculated by CIBERSORT.
  • Beta: Effect size.
  • P-value: P-value of correlation test.
  • Boxplot: The boxplot depicts the association between genotype and immune cell abundance. The Y-axis represents infiltrated immune cell abundance estimated by CIBERSORT and the X-axis represents different genotype.
  • Neighbor genes: The neighbor genes of each eRNA are provided with tabular view and graph view.
  • Predicted targets: The predicted genes of each eRNA are provided with tabular view and graph view.
  • Captured targets: The target genes of each eRNA captured using 3D genomic methods (ChIA-PET, Hi-C, Capture Hi-C) are provided with tabular view and graph view.

5. GWAS-eaQTL

Browse or search eaQTL colocalized with diseases/traits-associated SNPs

A scatter plot is displayed to show the co-localization between eaQTLs and diseases/traits GWAS SNPs.


Input


User should select a cancer type from the drop-down list to browse eaQTLs in a specific cancer type.

User could enter SNP ID to search eaQTL for a specific SNP.

User could enter an interesting potential enhancer genomic position to search eaQTL.


Result


This section provides tabular view of eaQTLs colocalized with diseases/traits-associated SNPs for query cancer type/SNP ID/genomic position. It includes:

  • Cancer type: The cancer type is denoted by TCGA abbreviations.
  • SNP ID: Reference SNP ID from dbSNP.
  • SNP position: The genomic position of SNP.
  • Traits/Diseases: GWAS related traits or diseases.
  • eRNA ID: The eRNA ID is named by genomic position.
  • eRNA position: The genomic position of eRNA.
  • PP4: A posterior probability of ≥75% is considered strong evidence of the eaQTL-GWAS pair influencing both the enhancer activity and GWAS trait at a particular region.
  • Neighbor genes: The neighbor genes of each eRNA are provided with tabular view and graph view.
  • Predicted targets: The predicted genes of each eRNA are provided with tabular view and graph view.
  • Captured targets: The target genes of each eRNA captured using 3D genomic methods (ChIA-PET, Hi-C, Capture Hi-C) are provided with tabular view and graph view.

1. eaQTLdb Introduction

eaQTLdb was release in May, 2022 and has 5 modules.

  • eaQTL: 1,042,092 eaQTL-eRNA pairs, corresponding to 21,368 unique eRNAs, are identified across 29 TCGA cancer types. In addition, the genomic neighbor genes, predicted target genes and captured target genes are provided with network view.
  • Hallmark-eaQTL: 537,627 eaQTL-eRNA pairs were found associated with 14 hallmarks of cancer, including genome instability & mutation, inducing angiogenesis, resisting cell death, deregulating cellular energetics, evading growth suppressors, enabling replicative immortality, avoiding immune destruction, tumor promoting inflammation, activating invasion & metastasis, sustaining proliferative signaling, nonmutational epigenetic reprogramming, polymorphic microbiomes, senescent cells, unlocking phenotypic plasticity.
  • Survival-eaQTL: By integrating eaQTLs with patients’ clinical data, 49,223 eaQTL-eRNA pairs associated with patients’ overall survival are identified. The Kaplan-Meier plots for each eaQTL are provided.
  • Immune-eaQTL: Immune cell infiltration has been shown to be important in patients’ prognosis and cancer treatment efficacy. The abundance of 24 different infiltrated immune cell types is estimated by ImmuCellAI. In total, 58,509 eaQTL-eRNA pairs associated with immune cell infiltration, corresponding to 24 immune cell types and 2,734 unique eRNAs, are identified across 33 TCGA cancer types.
  • GWAS-eaQTL: Genome-wide association studies (GWASs) have identified thousands of genetic risk loci for different diseases/traits. By integrating eaQTLs with curated GWAS summary statistics, we identified 9,603 eaQTL-eRNA pairs colocalized with diseases/traits-associated SNPs.

2. Database Contruction Pipeline

3. Summary of Data Resources Used in eaQTLdb

Summary of TCGA data used in eaQTLdb

4. Web Browser Compatibility

Tested web browser

5. Acknowledgements

Contact Information

Yang Yang (Corresponding Author)

Email: yy(AT)tmu.edu.cn

Jiapei Yuan (First Author)

Email: jiapeiyuan17(AT)gmail.com

Yang Tong (First Author)

Email: Tyang(AT)tmu.edu.cn


Affilation: Department of Pharmacology, School of Basic Medical Sciences, Tianjin Medical University

Address: 22 Qixiangtai Road, Heping District, Tianjin 300070, China


Any comments or suggestion are welcome to improve eaQTLdb.

Map


点标记